Fisheries and aquaculture products are an important source of protein and a crucial component of a healthy diet. This is particularly true for the average person living in the EU, who consumes 24 kg (live weight) of fish or seafood per year (3.3 kg more than in the rest of the world).
Consumption, however, varies greatly across the EU: from 6 kg per person per year in Czechia to 59.9 kg in Portugal.
Three quarters of the fish or seafood consumed in the EU comes from wild fisheries, while the remaining quarter comes from aquaculture. The most popular species are tuna, salmon and cod.
Consumption of fisheries and aquaculture products (2019)
(quantity in live weight (kg/inhabitant/year))
| PT | 59.91 |
| ES | 46.02 |
| DK (**) | 42.56 |
| FR | 33.26 |
| LU | 32.84 |
| IT | 31.21 |
| IE | 25.50 |
| SE | 25.16 |
| CY | 24.34 |
| EU-28 | 23.97 |
| FI | 23.77 |
| BE | 23.31 |
| HR | 20.82 |
| NL (*) | 20.60 |
| EL | 20.37 |
| UK (***) | 20.13 |
| EE (*) | 16.00 |
| LT | 13.90 |
| PL (*) | 13.11 |
| AT | 13.09 |
| DE (*) | 13.08 |
| SI | 12.18 |
| LV (*) | 10.46 |
| SK | 9.69 |
| RO | 8.11 |
| BG | 7.45 |
| HU | 6.28 |
| CZ (*) | 6.00 |
(*) Data are provided by the following National sources: BMEL-Statistik (Germany), CZSO Czech Statistical Office (Czechia), Estonian Institute of Economic Research (Estonia), Centrālā statistikas pārvalde (Latvia), Dutch Fish Marketing Board (Netherlands) and Statistics Poland (Poland).
(**) Estimates for Denmark were not confirmed by the National contact point.
(**) OECD forecast was used for the UK.
NB: Given the significant relevance of imports of frozen fish likely used as fishmeal in the Maltese bluefin tuna fattening industry, and given the increasing imports of live tuna for fattening purposes, available data and information for Malta do not allow to produce precise estimates. However, annual per capita apparent consumption can be estimated between 30-40 kg LWE.
Source: Eumofa experts.
Consumption of fisheries and aquaculture products in the major world economies (2019)
(quantity in live weight (kg/inhabitant/year))
| Norway | 54.56 |
| Japan | 46.74 |
| China | 40.42 |
| EU-28 | 23.97 |
| United States | 22.9 |
| Canada | 22.33 |
| Russia | 20.74 |
| WORLD AVERAGE | 20.66 |
| Brazil | 9.04 |
| India | 7.63 |
| Turkey | 5.09 |
Source: OECD forecast https://stats.oecd.org/Index.aspx?datasetcode=HIGH_AGLINK_2019, Eumofa elaboration of Eurostat and FAO data.
Main species consumed in the European Union (2019)
(quantity in live weight (kg/inhabitant/year))
| Main commercial species | Per capita (Kg) | % wild | % farmed |
|---|---|---|---|
| Tuna (mostly canned) | 3.10 | 99% | 1% |
| Salmon | 2.36 | 19% | 81% |
| Cod | 2.11 | 100% | 0% |
| Alaska pollock | 1.67 | 100% | 0% |
| Shrimps | 1.47 | 49% | 51% |
| Mussel | 1.23 | 20% | 80% |
| Hake | 1.02 | 100% | 0% |
| Herring | 0.98 | 100% | 0% |
| Squid | 0.62 | 100% | 0% |
| Surimi | 0.59 | 100% | 0% |
| Sardine | 0.58 | 100% | 0% |
Source: Eumofa elaboration of Eurostat and FAO data.
In the EU the total nominal household expenditure for fishery and aquaculture products in 2020 reached €64.1 billion. Spain registered the highest level of expenditure with €13.6 billion, followed by Italy (€12.3 billion) and France (€9.2 billion).
On average, expenditure for fishery and aquaculture products represents 6% of the total consumption budget for food products in the EU. The highest ratio is observed in Portugal (16%) and the lowest in Hungary (1.6%). For comparison, at the EU level, expenditure for meat products and for fruits and vegetables represent 23% and 22%, respectively, of total food expenditure.
Nominal household expenditure for purchasing fish and seafood in 2020
(million EUR)
| Meat | Fish | Fruits, vegetables, potatoes | |
|---|---|---|---|
| EU-28 | 245 018 | 64 104 | 235 071 |
| BE | 8 494 | 1 806 | 5 510 |
| BG | 1 482 | 214 | 1 271 |
| CZ | 4 210 | 430 | 2 597 |
| DK | 4 101 | 835 | 3 343 |
| DE | 36 401 | 6 167 | 38 448 |
| EE | 498 | 119 | 442 |
| IE | 2 473 | 374 | 2 395 |
| EL | 4 246 | 1 042 | 6 066 |
| ES | 27 482 | 13 608 | 22 927 |
| FR | 38 543 | 9 183 | 33 675 |
| HR | 1 407 | 296 | 1 120 |
| IT | 35 001 | 12 277 | 34 044 |
| CY | 325 | 113 | 423 |
| LV | 710 | 147 | 562 |
| LT | 1 174 | 395 | 1 020 |
| LU | 475 | 147 | 317 |
| HU | 2 695 | 170 | 1 863 |
| MT | 154 | 58 | 163 |
| NL | 9 190 | 2 048 | 10 001 |
| AT | 3 986 | 769 | 3 909 |
| PL | 10 704 | 1 140 | 11 697 |
| PT | 4 750 | 3 836 | 4 591 |
| RO | 12 364 | 1 667 | 7 936 |
| SI | 960 | 90 | 875 |
| SK | 2 485 | 410 | 1 480 |
| FI | 2 457 | 600 | 2 346 |
| SE | 4 983 | 1 800 | 5 510 |
| UK | 23 268 | 4 363 | 30 540 |
Source: Eurostat.
The supply of fisheries and seafood products to the EU market is ensured by the EU’s own production and by imports, leading to a total of 14.53 million tonnes (live weight) available for human consumption in 2019. In the same year, the ‘apparent consumption’, obtained by subtracting exports from this figure, was 12.30 million tonnes.
Supply balance (2019)
(volume in million tonnes live weight equivalent)
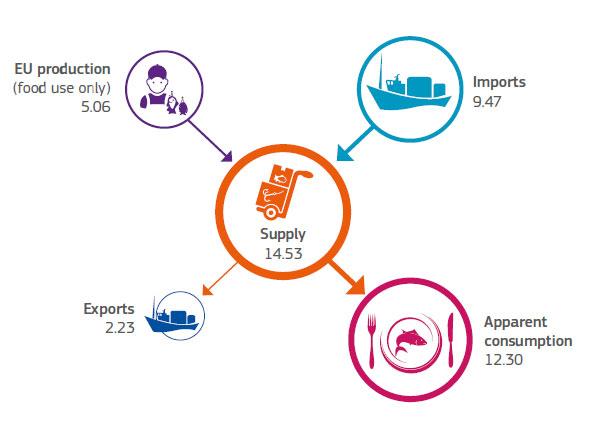
Source: Eumofa elaboration of Eurostat and FAO data.
Self-sufficiency can be expressed as the ratio between own production (catches plus aquaculture) and total apparent consumption. In 2019, the EU’s self-sufficiency rate stood at 41.2%, i.e., people living in the European Union consumed roughly twice as much as they produced.
The EU’s production covers almost two thirds of its consumption of pelagic fish and more than half of its consumption of molluscs. It is more dependent on external sourcing for salmonids, crustaceans and other fish.
The European Union’s self-sufficiency rate (2019)
(percentage by commodity group)
Source: Eumofa elaboration of Eurostat and FAO data.