The EU is the fifth largest fisheries and aquaculture producer worldwide, accounting for about 3% of global production. 78% of this production comes from fisheries and 22% from aquaculture.
Spain, Denmark and France and are the largest producers in terms of volume in the EU.
| Country | Catches | Aquaculture | Total production | % Total |
|---|---|---|---|---|
| China | 14 169 | 64 423 | 82 593 | 38.66% |
| Indonesia | 7 524 | 15 893 | 23 418 | 10.96% |
| India | 5 477 | 7 800 | 13 277 | 6.22% |
| Vietnam | 3 429 | 4 455 | 7 884 | 3.69% |
| EU-28 | 4 824 | 1 366 | 6 191 | 2.90% |
| United States | 4 803 | 490 | 5 293 | 2.48% |
| Russia | 4 983 | 248 | 5 231 | 2.45% |
| Peru | 4 851 | 153 | 5 005 | 2.34% |
| Philippines | 2 056 | 2 358 | 4 414 | 2.07% |
| Bangladesh | 1 895 | 2 488 | 4 384 | 2.05% |
| Japan | 3 230 | 943 | 4 174 | 1.95% |
| Norway | 2 472 | 1 453 | 3 925 | 1.84% |
| Chile | 2 376 | 1 407 | 3 783 | 1.77% |
| South Korea | 1 366 | 2 406 | 3 773 | 1.77% |
| Myanmar | 1 951 | 1 082 | 3 033 | 1.42% |
| Thailand | 1 542 | 964 | 2 506 | 1.17% |
| Others | 26 563 | 8 167 | 34 731 | 16.26% |
| Total | 93 519 | 120 103 | 213 623 | 100% |
NB: FAO estimates for non-EU countries.
Source: Eumofa elaboration of Eurostat and FAO data.
The EU accounts for around 5.1% of total fisheries production worldwide.
Although the EU fleet operates worldwide, catches are taken primarily in the North-East Atlantic. The most-fished species are Atlantic herring, European sprat, blue whiting and mackerel, which together account for almost 42% of EU landings.
The leading Member States (without taking into account the United Kingdom) in terms of fishing volume are Denmark, Spain, the Netherlands and France, which together account for 58% of all EU catches.
| Atlantic, North-East | 3 518 976 | 72.9% |
| Mediterranean | 418 287 | 8.7% |
| Atlantic, Eastern Central | 282 701 | 5.9% |
| Indian Ocean, West | 267 209 | 5.5% |
| Atlantic, South-West | 139 123 | 2.9% |
| Inland waters | 101 023 | 2.1% |
| Atlantic, North-West | 49 937 | 1.0% |
| Atlantic, South-East | 29 710 | 0.6% |
| Black Sea | 17 418 | 0.4% |
| Total fishing areas | 4 824 384 | 100% |
Source: Eumofa elaboration of Eurostat and FAO data.
| Country | Catches | % of total |
|---|---|---|
| China | 14 169 | 15.15% |
| Indonesia | 7 524 | 8.05% |
| India | 5 477 | 5.86% |
| Russia | 4 983 | 5.33% |
| Peru | 4 851 | 5.19% |
| EU-28 | 4 824 | 5.16% |
| United States | 4 803 | 5.14% |
| Vietnam | 3 429 | 3.67% |
| Japan | 3 230 | 3.45% |
| Norway | 2 472 | 2.64% |
| Chile | 2 376 | 2.54% |
| Philippines | 2 056 | 2.20% |
| Myanmar | 1 951 | 2.09% |
| Bangladesh | 1 895 | 2.03% |
| Mexico | 1 581 | 1.69% |
| Thailand | 1 542 | 1.65% |
| Others | 26 348 | 28.18% |
| Total | 93 518 | 100% |
NB: FAO estimates for extra-EU countries.
Source: Eumofa elaboration of Eurostat and FAO data.
| Country | Catches | % over the total |
|---|---|---|
| ES | 843 216 | 17.48% |
| DK | 636 678 | 13.20% |
| UK | 618 448 | 12.82% |
| FR | 526 226 | 10.91% |
| NL | 320 361 | 6.64% |
| IE | 238 439 | 4.94% |
| DE | 224 395 | 4.65% |
| PL | 199 250 | 4.13% |
| IT | 184 514 | 3.82% |
| SE | 184 337 | 3.82% |
| PT | 183 973 | 3.81% |
| FI | 163 916 | 3.40% |
| LV | 106 917 | 2.22% |
| LT | 101 970 | 2.11% |
| ET | 86 640 | 1.80% |
| EL | 83 172 | 1.72% |
| HR | 64 582 | 1.34% |
| BE | 21 344 | 0.44% |
| RO | 10 928 | 0.23% |
| BG | 10 329 | 0.21% |
| HU | 4 816 | 0.10% |
| CZ | 3 721 | 0.08% |
| MT | 2 230 | 0.05% |
| SK | 1 865 | 0.04% |
| CY | 1 500 | 0.03% |
| AT | 350 | 0.01% |
| SI | 266 | 0.006% |
| Total EU-28 | 4 824 384 | 100% |
NB: Not relevant for LU.
Sources: Eumofa elaboration of Eurostat and FAO data.
| Atlantic herring | 678 848 | 14.1% |
| European sprat | 429 227 | 8.9% |
| Blue whiting (= Poutassou) | 351 079 | 7.3% |
| Atlantic mackerel | 327 610 | 6.8% |
| Skipjack tuna | 226 513 | 4.7% |
| European pilchard (= Sardine) | 184 135 | 3.8% |
| Atlantic horse mackerel | 158 375 | 3.3% |
| European anchovy | 114 904 | 2.4% |
| Yellowfin tuna | 113 048 | 2.3% |
| Sandeels (= Sandlances) nei | 110 724 | 2.3% |
| European hake | 103 677 | 2.1% |
| Atlantic cod | 103 597 | 2.1% |
| Argentine hake | 98 542 | 2.0% |
| Atlantic chub mackerel | 75 886 | 1.6% |
| European plaice | 61 522 | 1.3% |
Sources: Eurostat for marine fishing and FAO for inland water catches. Eurostat data were integrated by using FAO data in case of confidentialities.
| BE | ||
| European plaice | 5 700 | 26.7% |
| Common sole | 2 437 | 11.4% |
| Anglerfishes nei | 1 192 | 5.6% |
| Common cuttlefish | 817 | 3.8% |
| Atlantic cod | 783 | 3.7% |
| BG | ||
| European sprat | 4 585 | 44.4% |
| Sea snails | 4 222 | 40.9% |
| Red mullet | 554 | 5.4% |
| Sand gaper | 508 | 4.9% |
| CZ | ||
| Common carp | 2 916 | 78.4% |
| DK | ||
| European sprat | 154 036 | 24.2% |
| Atlantic herring | 125 893 | 19.8% |
| Sandeels (= Sandlances) nei | 93 795 | 14.7% |
| Blue whiting (= Poutassou) | 68 635 | 10.8% |
| DE | ||
| Atlantic herring | 48 836 | 21.8% |
| Blue whiting (= Poutassou) | 37 710 | 16.8% |
| European sprat | 18 278 | 8.1% |
| Atlantic mackerel | 16 670 | 7.4% |
| Freshwater fishes nei | 14 960 | 6.7% |
| Atlantic cod | 13 362 | 6.0% |
| EE | ||
| Atlantic herring | 32 833 | 37.9% |
| European sprat | 30 649 | 35.4% |
| Northern prawn | 9 795 | 11.3% |
| IE | ||
| Atlantic mackerel | 53 490 | 22.4% |
| Blue whiting (= Poutassou) | 38 569 | 16.2% |
| Atlantic horse mackerel | 28 899 | 12.1% |
| North Atlantic rockweed | 28 000 | 11.7% |
| European sprat | 13 012 | 5.5% |
| EL | ||
| European anchovy | 15 278 | 18.4% |
| European pilchard (= Sardine) | 13 581 | 16.3% |
| Marine fishes nei | 4 947 | 5.9% |
| European hake | 4 429 | 5.3% |
| ES | ||
| Skipjack tuna | 160 404 | 19.0% |
| Argentine hake | 98 251 | 11.7% |
| Yellowfin tuna | 63 463 | 7.5% |
| European anchovy | 47 591 | 5.6% |
| Blue shark | 38 447 | 4.6% |
| Atlantic horse mackerel | 36 197 | 4.3% |
| FR | ||
| Skipjack tuna | 61 017 | 11.6% |
| Yellowfin tuna | 47 160 | 9.0% |
| Tangle | 38 202 | 7.3% |
| European hake | 34 692 | 6.6% |
| Great Atlantic scallop | 32 360 | 6.1% |
| European pilchard (= Sardine) | 25 045 | 4.8% |
| HR | ||
| European pilchard (= Sardine) | 45 105 | 69.8% |
| European anchovy | 7 996 | 12.4% |
| IT | ||
| European anchovy | 31 198 | 16.9% |
| European pilchard (= Sardine) | 23 469 | 12.7% |
| Striped venus | 15 929 | 8.6% |
| Deep-water rose shrimp | 9 012 | 4.9% |
| European hake | 7 050 | 3.8% |
| CY | ||
| Albacore | 655 | 43.6% |
| Atlantic bluefin tuna | 151 | 10.1% |
| Bogue | 85 | 5.7% |
| Picarel | 64 | 4.3% |
| LV | ||
| European sprat | 38 710 | 36.2% |
| Atlantic herring | 25 602 | 23.9% |
| Jack and horse mackerels nei | 15 999 | 15.0% |
| Atlantic chub mackerel | 15 142 | 14.2% |
| LT | ||
| Chub mackerel | 29 155 | 28.6% |
| Atlantic horse mackerel | 24 795 | 24.3% |
| European sprat | 16 229 | 15.9% |
| European pilchard (= Sardine | 11 690 | 11.5% |
| HU | ||
| Common carp | 3 386 | 63.8% |
| MT | ||
| Atlantic chub mackerel | 504 | 22.6% |
| Common dolphinfish | 411 | 18.4% |
| Swordfish | 407 | 18.3% |
| Silver scabbardfish | 136 | 6.1% |
| NL | ||
| Atlantic herring | 83 799 | 26.2% |
| Blue whiting (= Poutassou) | 74 599 | 23.3% |
| Atlantic horse mackerel | 32 017 | 10.0% |
| European plaice | 24 216 | 7.6% |
| Atlantic mackerel | 22 370 | 7.0% |
| PL | ||
| European sprat | 74 492 | 37.4% |
| Atlantic herring | 40 822 | 20.5% |
| Blue whiting (= Poutassou) | 26 958 | 13.5% |
| European flounder | 16 711 | 8.4% |
| Freshwater fishes nei | 16 008 | 8.0% |
| PT | ||
| Atlantic chub mackerel | 44 669 | 24.3% |
| Atlantic horse mackerel | 16 769 | 9.1% |
| Atlantic redfishes nei | 13 019 | 7.1% |
| Blue shark | 11 973 | 6.5% |
| European pilchard (= Sardine) | 10 230 | 5.6% |
| Atlantic cod | 10 012 | 5.4% |
| RO | ||
| Thomas' rapa whelk | 6 815 | 62.4% |
| Goldfish | 1 659 | 15.2% |
| SI | ||
| Common carp | 66 | 24.8% |
| Whiting | 24 | 9.2% |
| Rainbow trout | 24 | 9.0% |
| Musky octopus | 16 | 6.1% |
| Common sole | 11 | 4.3% |
| Gilthead seabream | 11 | 4.0% |
| SK | ||
| Common carp | 1 400 | 75.1% |
| FI | ||
| Atlantic herring | 113 113 | 69.0% |
| European sprat | 16 092 | 9.8% |
| SE | ||
| Atlantic herring | 94 182 | 51.1% |
| European sprat | 58 532 | 31.8% |
| Sandeels(= Sandlances) nei | 11 544 | 6.3% |
| UK | ||
| Atlantic mackerel | 152 143 | 24.6% |
| Atlantic herring | 75 456 | 12.2% |
| Blue whiting (= Poutassou) | 60 791 | 9.8% |
| Norway lobster | 34 459 | 5.6% |
NB: Not relevant for LU. Data by main species is not available for AT.
Sources: Eurostat for marine fishing and FAO for inland water catches.
Eurostat data were integrated by using FAO data in case of confidentialities.
Aquaculture is a significant activity in many Member States, producing around 1.37 million tonnes (1) in volume and more than €5 billion in value. Mediterranean mussels make up around 36% of the total volume farmed in the EU, while Atlantic salmon and rainbow trout together represent another 30% of the main commercial species. The main aquaculture-producing Member States in terms of volume are Spain, France, Italy and Greece.
Of the total world aquaculture production, the EU occupies a share of 1.13% in terms of volume and 2.29% in terms of value.
(1) In line with the approach adopted by the European Market Observatory for Fisheries and Aquaculture Products (Eumofa) following Brexit, the United Kingdom is considered part of the EU till 2019 and its data until that year are available in all tables, charts and analyses at EU level. In addition, EU data include Croatia since 2013, date of the EU’s enlargement to this country.
| Country | Value | % Value | Volume | % volume |
|---|---|---|---|---|
| UK | 1 308 220 | 26.24% | 219 500 | 16.06% |
| FR | 758 655 | 15.22% | 194 335 | 14.22% |
| ES | 633 106 | 12.70% | 306 572 | 22.43% |
| EL | 508 058 | 10.19% | 128 748 | 9.42% |
| IT | 453 156 | 9.09% | 153 937 | 11.26% |
| MT | 161 912 | 3.25% | 13 823 | 1.01% |
| IE | 157 663 | 3.16% | 34 977 | 2.56% |
| DE | 126 109 | 2.53% | 41 077 | 3.01% |
| DK | 124 464 | 2.50% | 40 221 | 2.94% |
| HR | 120 687 | 2.42% | 20 444 | 1.50% |
| PL | 114 756 | 2.30% | 42 627 | 3.12% |
| PT | 90 328 | 1.81% | 11 475 | 0.84% |
| NL | 84 052 | 1.69% | 46 340 | 3.39% |
| FI | 62 370 | 1.25% | 15 296 | 1.12% |
| CY | 43 753 | 0.88% | 8 079 | 0.59% |
| CZ | 41 237 | 0.83% | 20 989 | 1.54% |
| HU | 35 985 | 0.72% | 17 315 | 1.27% |
| SE | 34 827 | 0.70% | 11 497 | 0.84% |
| RO | 31 871 | 0.64% | 12 848 | 0.94% |
| BG | 29 719 | 0.60% | 11 963 | 0.88% |
| AT | 29 596 | 0.59% | 4 242 | 0.31% |
| LT | 11 982 | 0.24% | 3 776 | 0.28% |
| SK | 7 278 | 0.15% | 2 739 | 0.20% |
| EE | 7 278 | 0.15% | 1 062 | 0.08% |
| SI | 6 093 | 0.12% | 2 087 | 0.15% |
| LV | 1 852 | 0.04% | 628 | 0.05% |
| BE | 538 | 0.01% | 86 | 0.01% |
| Total EU-28 | 4 985 551 | 100% | 1 366 682 | 100% |
NB: Not relevant for LU.
Sources: Eumofa elaboration of Eurostat and FAO data..
Source: Eumofa elaboration of Eurostat and FAO data.
| Country | Value | % Value | Volume | % Volume |
|---|---|---|---|---|
| China | 143 968 509 | 58.68% | 68 423 859 | 56.97% |
| Indonesia | 13 018 009 | 5.31% | 15 893 400 | 13.23% |
| India | 12 965 661 | 5.28% | 7 800 300 | 6.49% |
| Vietnam | 10 758 166 | 4.38% | 4 455 557 | 3.71% |
| Chile | 9 788 299 | 3.99% | 1 407 286 | 1.17% |
| Norway | 7 281 989 | 2.97% | 1 453 042 | 1.21% |
| Bangladesh | 5 403 903 | 2.20% | 2 488 600 | 2.07% |
| EU-28 | 4 985 551 | 2.03% | 1 366 682 | 1.14% |
| Japan | 4 599 929 | 1.87% | 943 748 | 0.79% |
| Thailand | 2 857 667 | 1.16% | 964 266 | 0.80% |
| Egypt | 2 556 831 | 1.04% | 1 641 949 | 1.37% |
| South Korea | 2 493 821 | 1.02% | 2 406 351 | 2.00% |
| Ecuador | 2 323 907 | 0.95% | 695 835 | 0.58% |
| Philippines | 2 032 010 | 0.83% | 2 358 238 | 1.96% |
| Iran | 1 645 936 | 0.67% | 505 000 | 0.42% |
| Myanmar | 1 645 752 | 0.67% | 1 082 153 | 0.90% |
| Others | 17 019 608 | 6.94% | 6 218 046 | 5.18% |
| Total | 245 345 548 | 100% | 120 104 313 | 100% |
Source: Eumofa elaboration of Eurostat and FAO data.
| Main commercial species | Value | % Value |
|---|---|---|
| Atlantic salmon | 1 340 985 | 26.90% |
| Rainbow trout | 647 463 | 12.99% |
| Gilthead seabream | 494 100 | 9.91% |
| European seabass | 491 439 | 9.86% |
| Pacific cupped oyster | 443 578 | 8.90% |
| Atlantic bluefin tuna | 308 195 | 6.18% |
| Blue mussel | 234 546 | 4.70% |
| Mediterranean mussel | 197 995 | 3.97% |
| Common carp | 149 766 | 3.00% |
| Japanese carpet shell | 145 622 | 2.92% |
Source: Eumofa elaboration of Eurostat and FAO data.
| Main commercial species | Volume | % VOLUME |
|---|---|---|
| Mediterranean mussel | 335 236 | 24.53% |
| Atlantic salmon | 203 810 | 14.91% |
| Rainbow trout | 187 249 | 13.70% |
| Blue mussel | 138 020 | 10.10% |
| Pacific cupped oyster | 97 019 | 7.10% |
| Gilthead seabream | 95 207 | 6.97% |
| European seabass | 86 149 | 6.30% |
| Common carp | 67 964 | 4.97% |
| Japanese carpet shell | 28 336 | 2.07% |
| Atlantic bluefin tuna | 22 434 | 1.64% |
Source: Eumofa elaboration of Eurostat and FAO data
| BE | Value | % Value | Volume | % Volume |
| Freshwater fishes nei | 538.35 | 100% | 86 | 100% |
| BG | Value | % Value | Volume | % Volume |
| Rainbow trout | 16 001 | 53.8% | 3 830 | 32% |
| Common carp | 6 634 | 22.3% | 2 989 | 25% |
| Mediterranean mussel | 2 406 | 8.1% | 2 735 | 22.9% |
| Bighead carp | 1 349 | 4.5% | 1 382 | 11.5% |
| CZ | Value | % Value | Volume | % Volume |
| Common carp | 32 857 | 100% | 17 945 | 85.1% |
| DK | Value | % Value | Volume | % Volume |
| Rainbow trout | 100 269 | 80.6% | 30 852 | 76.7% |
| Atlantic salmon | 7 835 | 6.3% | 1 463 | 3.6% |
| DE | Value | % Value | Volume | % Volume |
| Blue mussel | 44 293 | 35.1% | 22 037 | 53.6% |
| Rainbow trout | 30 579 | 24.2% | 7 841 | 19.1% |
| European eel | 15 493 | 12.3% | 1 202 | 2.9% |
| Common carp | 11 927 | 9.5% | 4 641 | 11.3% |
| EE | Value | % Value | Volume | % Volume |
| Freshwater fishes nei | 3 832 | 52.6% | 63 | 5.9% |
| Rainbow trout | 3 069 | 42.2% | 927 | 87.3% |
| IE | Value | % Value | Volume | % Volume |
| Atlantic salmon | 106 950 | 67.8% | 11 333 | 32% |
| Pacific cupped oyster | 32 935 | 20.9% | 7 554 | 22% |
| Blue mussel | 14 820 | 9.4% | 15 184 | 43% |
| EL | Value | % Value | Volume | % Volume |
| Gilthead seabream | 253 108 | 49.8% | 55 500 | 43.1% |
| European seabass | 200 465 | 39.5% | 41 255 | 32.0% |
| ES | Value | % Value | Volume | % Volume |
| European seabass | 154 641 | 24.4% | 25 260 | 8.2% |
| Atlantic bluefin tuna | 124 314 | 19.6% | 7 717 | 2.5% |
| Mediterranean mussel | 119 659 | 18.9% | 228 195 | 74.4% |
| Gilthead seabream | 63 779 | 10.1% | 12 475 | 4.1% |
| Turbot | 61 781 | 9.8% | 8 011 | 2.6% |
| Rainbow trout | 52 178 | 8.2% | 15 914 | 5.2% |
| FR | Value | % Value | Volume | % Volume |
| Pacific cupped oyster | 391 127 | 51.6% | 84 760 | 43.6% |
| Rainbow trout | 125 308 | 16.5% | 34 540 | 17.8% |
| Blue mussel | 123 383 | 16.3% | 54 208 | 27.9% |
| European seabass | 20 740 | 2.7% | 2 461 | 1.3% |
| HR | Value | % Value | Volume | % Volume |
| Gilthead seabream | 39 087 | 32.4% | 6 774 | 33.1% |
| European seabass | 35 880 | 29.7% | 6 089 | 29.8% |
| Atlantic bluefin tuna | 31 811 | 26.4% | 2 747 | 13.4% |
| Meagre | 4 828 | 4.0% | 725 | 3.5% |
| IT | Value | % Value | Volume | % Volume |
| Japanese carpet shell | 135 450 | 29.9% | 27 090 | 17.6% |
| Rainbow trout | 101 341 | 22.4% | 35 000 | 21.4% |
| Gilthead seabream | 75 430 | 16.6% | 9 500 | 6.2% |
| European seabass | 55 870 | 12.3% | 7 400 | 4.8% |
| Mediterranean mussel | 54 338 | 12.0% | 72 450 | 47.1% |
| CY | Value | % Value | Volume | % Volume |
| Gilthead seabream | 25 220 | 57.6% | 5 168 | 64.0% |
| European seabass | 17 838 | 40.8% | 2 836 | 35.1% |
| LV | Value | % Value | Volume | % Volume |
| Common carp | 1 222 | 66.0% | 513 | 81.6% |
| Sturgeons nei | 320 | 17.3% | 45 | 7.1% |
| Rainbow trout | 230 | 12.4% | 50 | 8.0% |
| LT | Value | % Value | Volume | % Volume |
| Common carp | 7 565 | 63.1% | 2 742 | 72.6% |
| North African catfish | 1 192 | 10.0% | 312 | 8.3% |
| HU | Value | % Value | Volume | % Volume |
| Common carp | 24 565 | 68.3% | 11 436 | 66.0% |
| Torpedo-shaped catfishes nei | 6 691 | 18.6% | 3 610 | 20.8% |
| Wels (=Som) catfish | 1 119 | 3.1% | 206 | 1.2% |
| MT | Value | % Value | Volume | % Volume |
| Atlantic bluefin tuna | 152 070 | 93.9% | 11 970 | 86.6% |
| Gilthead seabream | 9 359 | 5.8% | 1 783 | 12.9% |
| NL | Value | % Value | Volume | % Volume |
| Blue mussel | 45 598 | 54.2% | 38 094 | 82.2% |
| European eel | 18 700 | 22.2% | 2 200 | 4.7% |
| Cupped oysters nei | 5 142 | 6.1% | 2 323 | 5.0% |
| AT | Value | % Value | Volume | % Volume |
| Rainbow trout | 9 602 | 32.4% | 1 417 | 33.4% |
| Arctic char | 4 452 | 15.0% | 266 | 6.3% |
| Brook trout | 3 830 | 12.9% | 562 | 13.3% |
| PL | Value | % Value | Volume | % Volume |
| Rainbow trout | 45 961 | 40.1% | 15 395 | 36.1% |
| Common carp | 37 757 | 32.9% | 18 376 | 43.1% |
| PT | Value | % Value | Volume | % Volume |
| Grooved carpet shell | 35 563 | 36.0% | 1 725 | 15.0% |
| Turbot | 27 949 | 30.9% | 3 580 | 31.2% |
| Gilthead seabream | 9 231 | 10.2% | 1 662 | 14.5% |
| Pacific cupped oyster | 7 775 | 8.6% | 1 462 | 12.7% |
| RO | Value | % Value | Volume | % Volume |
| Common carp | 11 272 | 35.4% | 4 191 | 32.6% |
| Rainbow trout | 9 683 | 30.4% | 2 618 | 20.4% |
| Bighead carp | 5 008 | 15.7% | 2 870 | 22.3% |
| Silver carp | 2 298 | 7.2% | 1 465 | 11.4% |
| Crucian carp | 1 717 | 5.4% | 975 | 7.6% |
| SI | Value | % Value | Volume | % Volume |
| Rainbow trout | 4 076 | 66.9% | 937 | 44.9% |
| Mediterranean mussel | 567 | 9.3% | 798 | 38.3% |
| Warty venus | 415 | 6.8% | 36 | 1.7% |
| European seabass | 400 | 6.6% | 80 | 3.8% |
| SK | Value | % Value | Volume | % Volume |
| Rainbow trout | 3 230 | 44.3% | 993 | 36.3% |
| North African catfish | 1 961 | 26.9% | 922 | 33.7% |
| Common carp | 1 695 | 23.3% | 703 | 26% |
| FI | Value | % Value | Volume | % Volume |
| Rainbow trout | 53 051 | 85.1% | 14 204 | 92.9% |
| European whitefish | 7 537 | 12.1% | 786 | 5.1% |
| SE | Value | % Value | Volume | % Volume |
| Rainbow trout | 27 273 | 78.3% | 8 304 | 72.2% |
| Arctic char | 5 549 | 15.9% | 1 130 | 9.8% |
| UK | Value | % Value | Volume | % Volume |
| Atlantic salmon | 1 222 843 | 93.5% | 190 500 | 86.8% |
| Rainbow trout | 50 896 | 3.9% | 11 900 | 5.4% |
NB: Not relevant for LU.
Sources: Eurostat and Eumofa.
The fish processing industry in the EU is generally profitable. Overall, turnover in 2018 was roughly €30 billion, with Spain, France and Poland as the main contributors.
| ES | 6 930.5 |
| FR | 4 823.4 |
| PL | 3 434.4 |
| DE | 2 771.7 |
| IT | 2 721.7 |
| DK | 2 509.1 |
| PT | 1 353.5 |
| NL | 1 039.2 |
| SE | 751.6 |
| LT | 709 |
| BE | 674.3 |
| IE | 507.1 |
| FI | 402.4 |
| LV | 209.4 |
| EL | 181.4 |
| EE | 136.3 |
| RO | 106.3 |
| CZ | 96.4 |
| HR | 87.4 |
| SK | 72.2 |
| BG | 65.2 |
| AT | 44.9 |
| SI | 11.9 |
| HU | 7.2 |
| Total | 29 646.5 |
NB: Not relevant for LU.
Sources: Eurostat and STECF, The EU Fish Processing Sector – Economic report (STECF-19-15), Publications Office of the European Union, Luxembourg, 2019, ISBN 978-92-76-14666-7.
Producer organisations (2021)
Fishermen and fish farmers may join forces through producer organisations to make their production sustainable and to market their products efficiently. They do so by developing production and marketing plans. These organisations are key actors in fisheries and aquaculture. In 2021, there were 204 producer organisations across 18 Member States.
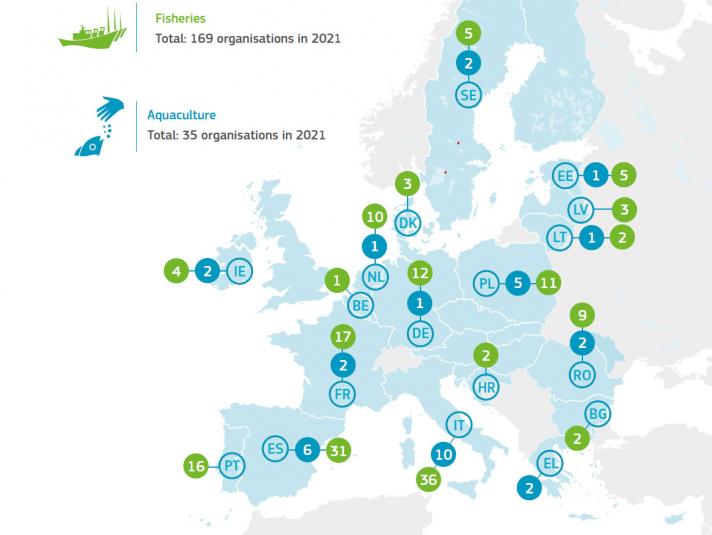
NB: In CZ, CY, LU, HU, MT, AT, SI, SK and FI there were no producer organisations.
Source: Member States; data retrieved on 14 September 2021.
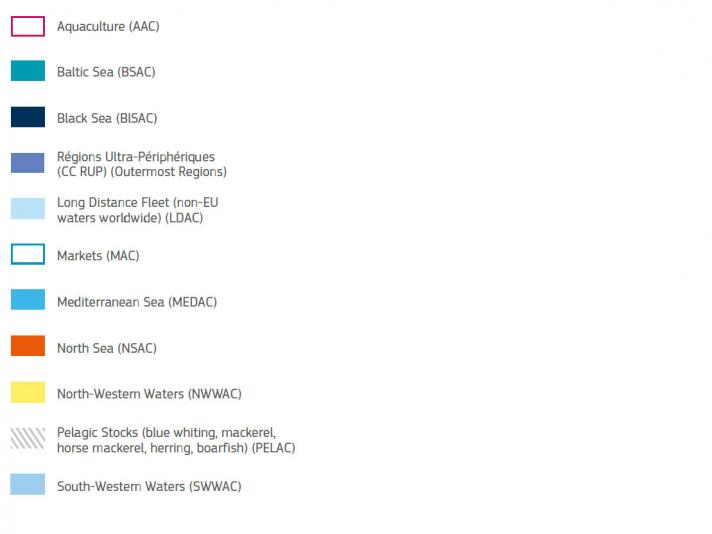
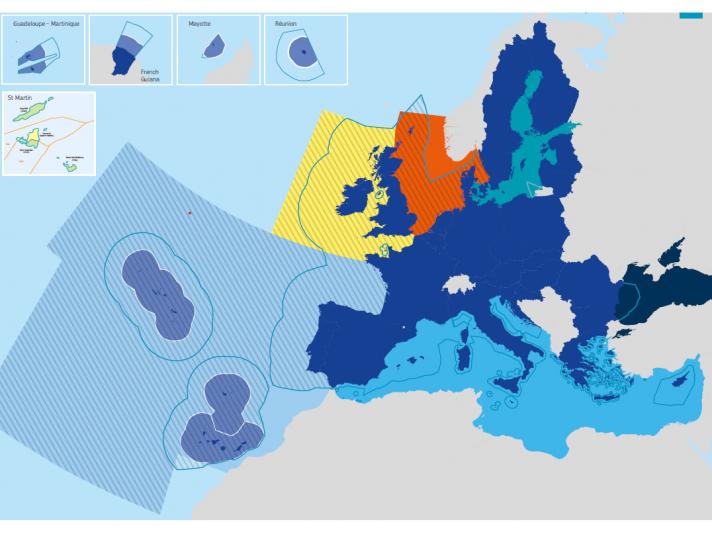
Advisory councils
Advisory councils are stakeholder organisations made up of representatives from the industry and other interest groups (which have 60% and 40% of the seats in the general assembly and the executive committee, respectively). Their purpose is to submit recommendations on issues related to fisheries and aquaculture to the Commission and Member States. Advisory councils may also provide information for the development of conservation measures, while Member States are to consult with them in the context of regionalisation.
Because they are pursuing a goal of general interest for the EU, advisory councils receive financial assistance from the Commission to cover part of their operational costs.
In addition to the seven existing advisory councils (Baltic Sea, Long Distance Fleet, Mediterranean Sea, North Sea, North-Western Waters, Pelagic Stocks, South-Western Waters), the 2013 CFP reform established four new advisory councils for the Black Sea, Aquaculture, Markets and Outermost Regions, which are now fully operational.