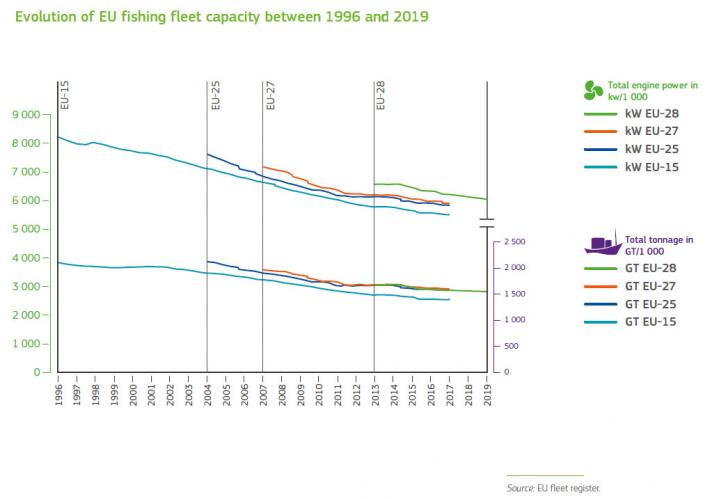
Managing fleet capacity is an essential part of ensuring sustainable fishing, one of the main objectives of the common fisheries policy (CFP).
The EU fishing fleet is very diverse, with vessels ranging from under 6 metres to over 75 metres. Under EU law, the total capacity of the fishing fleet needs to remain below set ceilings. Any decommissioning of vessels or reduction in fleet capacity achieved with public financial support must be permanent.
| Length | Number of vessels | Gross tonnage | Engine power in kW | Average age | |
|---|---|---|---|---|---|
| < 12 | 63 841 | 149 758 | 2 166 459 | 34.4 | |
| 12-24 | 8 524 | 321 324 | 1 510 853 | 33.0 | |
| > 24 | 2 270 | 847 287 | 1 623 963 | 27.4 | |
| TOTAL | 74 635 | 1 318 368 | 5 301 274 | 31.5 | |
NB: Length refers to total length.
Source: EU fishing fleet register. Situation as in July 2021.
Over the past several years the capacity of the EU fishing fleet has continued to decline in terms of both tonnage and engine power. The number of EU vessels in July 2021 was 74,635, i.e. 6,186 fewer than in July 2013 for the 27 Member States that now make up the EU. Nevertheless, the capacity of several fleet segments in the Member States is still not in balance with their fishing opportunities. The Member States concerned must adopt action plans to remedy this situation.
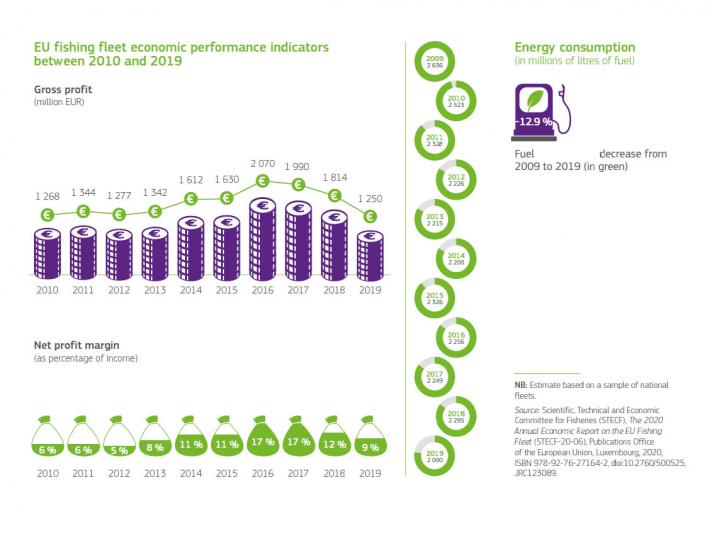
Healthier stocks contribute to a more sustainable industry. The EU fleet was profitable in 2019, generating an amount of gross value added (GVA) of €3.4 billion, and of gross profit (all excluding subsidies) of €1.2 billion. After accounting for capital costs, 9% of the revenue generated by the fleet was retained as net profit (€595 million). This consolidates the gradual recovery seen in recent years, in which the EU fleet appears to be more financially resilient than previously, thanks to the progress made under the CFP to manage stocks at sustainable levels.
| Number of vessels | % | Gross tonnage | % | Engine power in kW | % | |
|---|---|---|---|---|---|---|
| BE | 67 |
0.1% |
13 627 | 1.0% | 44 733 | 0.8% |
| BG | 1 816 | 2.4% | 6 005 | 0.5% | 53 117 | 1.0% |
| DK | 2 005 | 2.7% | 66 815 | 5.1% | 216 798 | 4.1% |
| DE | 1 281 | 1.7% | 57 293 | 4.3% | 128 391 | 2.4% |
| EE | 1 856 | 2.5% | 17 551 | 1.3% | 49 182 | 0.9% |
| IE | 1 935 | 2.6% | 58 954 | 4.5% | 173 852 | 3.3% |
| EL | 14 581 | 19.5% | 69 016 | 5.2% | 414 943 | 7.8% |
| ES | 8 776 | 11.7% | 329 374 | 25.0% | 772 803 | 14.6% |
| FR | 6 262 | 8.4% | 176 331 | 13.4% | 970 535 | 18.3% |
| HR | 7 535 | 10.1% | 43 272 | 3.3% | 342 999 | 6.5% |
| IT | 12 168 | 16.3% | 146 777 | 11.1% | 937 532 | 17.7% |
| CY | 814 | 1.1% | 3 808 | 0.3% | 38 985 | 0.7% |
| LV | 659 | 0.9% | 22 371 | 1.7% | 39 384 | 0.7% |
| LT | 137 | 0.2% | 36 030 | 2.7% | 41 913 | 0.8% |
| MT | 884 | 1.2% | 6 451 | 0.5% | 72 279 | 1.4% |
| NL | 720 | 1.0% | 99 440 | 7.5% | 244 503 | 4.6% |
| PL | 821 | 1.1% | 32 396 | 2.5% | 80 430 | 1.5% |
| PT | 7 791 | 10.4% | 86 945 | 6.6% | 344 925 | 6.5% |
| RO | 178 | 0.2% | 1 624 | 0.1% | 6 343 | 0.1% |
| SI | 137 | 0.2% | 671 | 0.05% | 8 853 | 0.2% |
| FI | 3 179 | 4.3% | 15 922 | 1.2% | 171 440 | 3.2% |
| SE | 1 136 | 1.5% | 28 577 | 2.2% | 148 208 | 2.8% |
| EU-27 | 74 738 | 100% | 1 319 250 | 100% | 5 302 148 | 100% |
Source: EU fishing fleet register. Situation as in July 2021.
Find out more